Cant believe it went by so quickly! I spent the afternoon modifying my poster to decide at the end of the day that I still didnt like it and in fact did not like the majority of the changes I did. Therefore I restored my version from freaking 11 am yesterday and I am going to do it all over again. Hopefully I will like my poster more by the end of today. Hope yall are all doing well with yalls posters! See everyone on FRIDAY!
It’s our last week! Where has the time gone!Today was my last day working on my research. I was running my transfected cells through the flow cytometer! I had some cell death (we kind of knew that it would happen), but I should have some much needed results on my poster!
Down to the final week of RET and reflecting on what a wonderful learning experience this has been. I am looking forward to seeing everyone’s final posters this week.
Today I got to use the camera that measures contact angle and finally visualize some differences in our products. I also ran a dispersibility over time test to see how well my samples stayed in solution. I will be adding these results to my poster over the next day and hopefully everything finally comes together into a cohesive story.
Happy final days, and thanks for all the wonderful memories these weeks!
Well, after successfully hardening the clay into ceramic, we began testing the pieces (a regular clay for control, and a TiO2 coated piece) using methyl blue. We had a surprising reaction because the TiO2 absorbed some methyl blue, which didn’t bleach as we exposed it to UV light. The methyl blue solution did degrade some for both the control and the coated piece. However, there were still trace amounts of methyl blue for both samples after 6 hours. I got to use a UV photospectrometer to analyze the samples, which was pretty awesome.
We tested Saturday to get data, and we started another reaction today. Hopefully, we’ll get better results!
Oh my goodness everyone!! Here we are on our LAST WEEK!!! How crazy is this?! How fast does time fly?!
Last week, I mostly worked on my video and poster that we had to complete for NEWT RET. In the mornings, I would autoclave tips, tubes, and/or prepare agar/buffer for the week.
I also showed a high school student that was interning in our lab how to pipette and to reduce the amount of bacteria being exposed.
This week was hectic- I finalized my program on Wednesday with a lot of help from Yong, our mentor. Although, I wanted to the computer to calculate the heart-rate- I ended up settling with raw manual data analysis.
I was working on my poster like a madman on Thursday and Friday. I am quite proud of my final product. I haven’t received my feedback, so that should be exciting. I used a QR code on my poster as well- thanks to Jimmy for that idea.
I got my results and conclusion- I would have love to increase my sample size, but I ran out of time. As a group, we have to start planning how we will teach next week- I’m interested to see how high school students will be different compared to my middle-school students.
Picture of Shelia’s program- while I comparing our PPG outputs.Pictures of my program
Single Pulse read from Webcam and Finger Pulse Senso
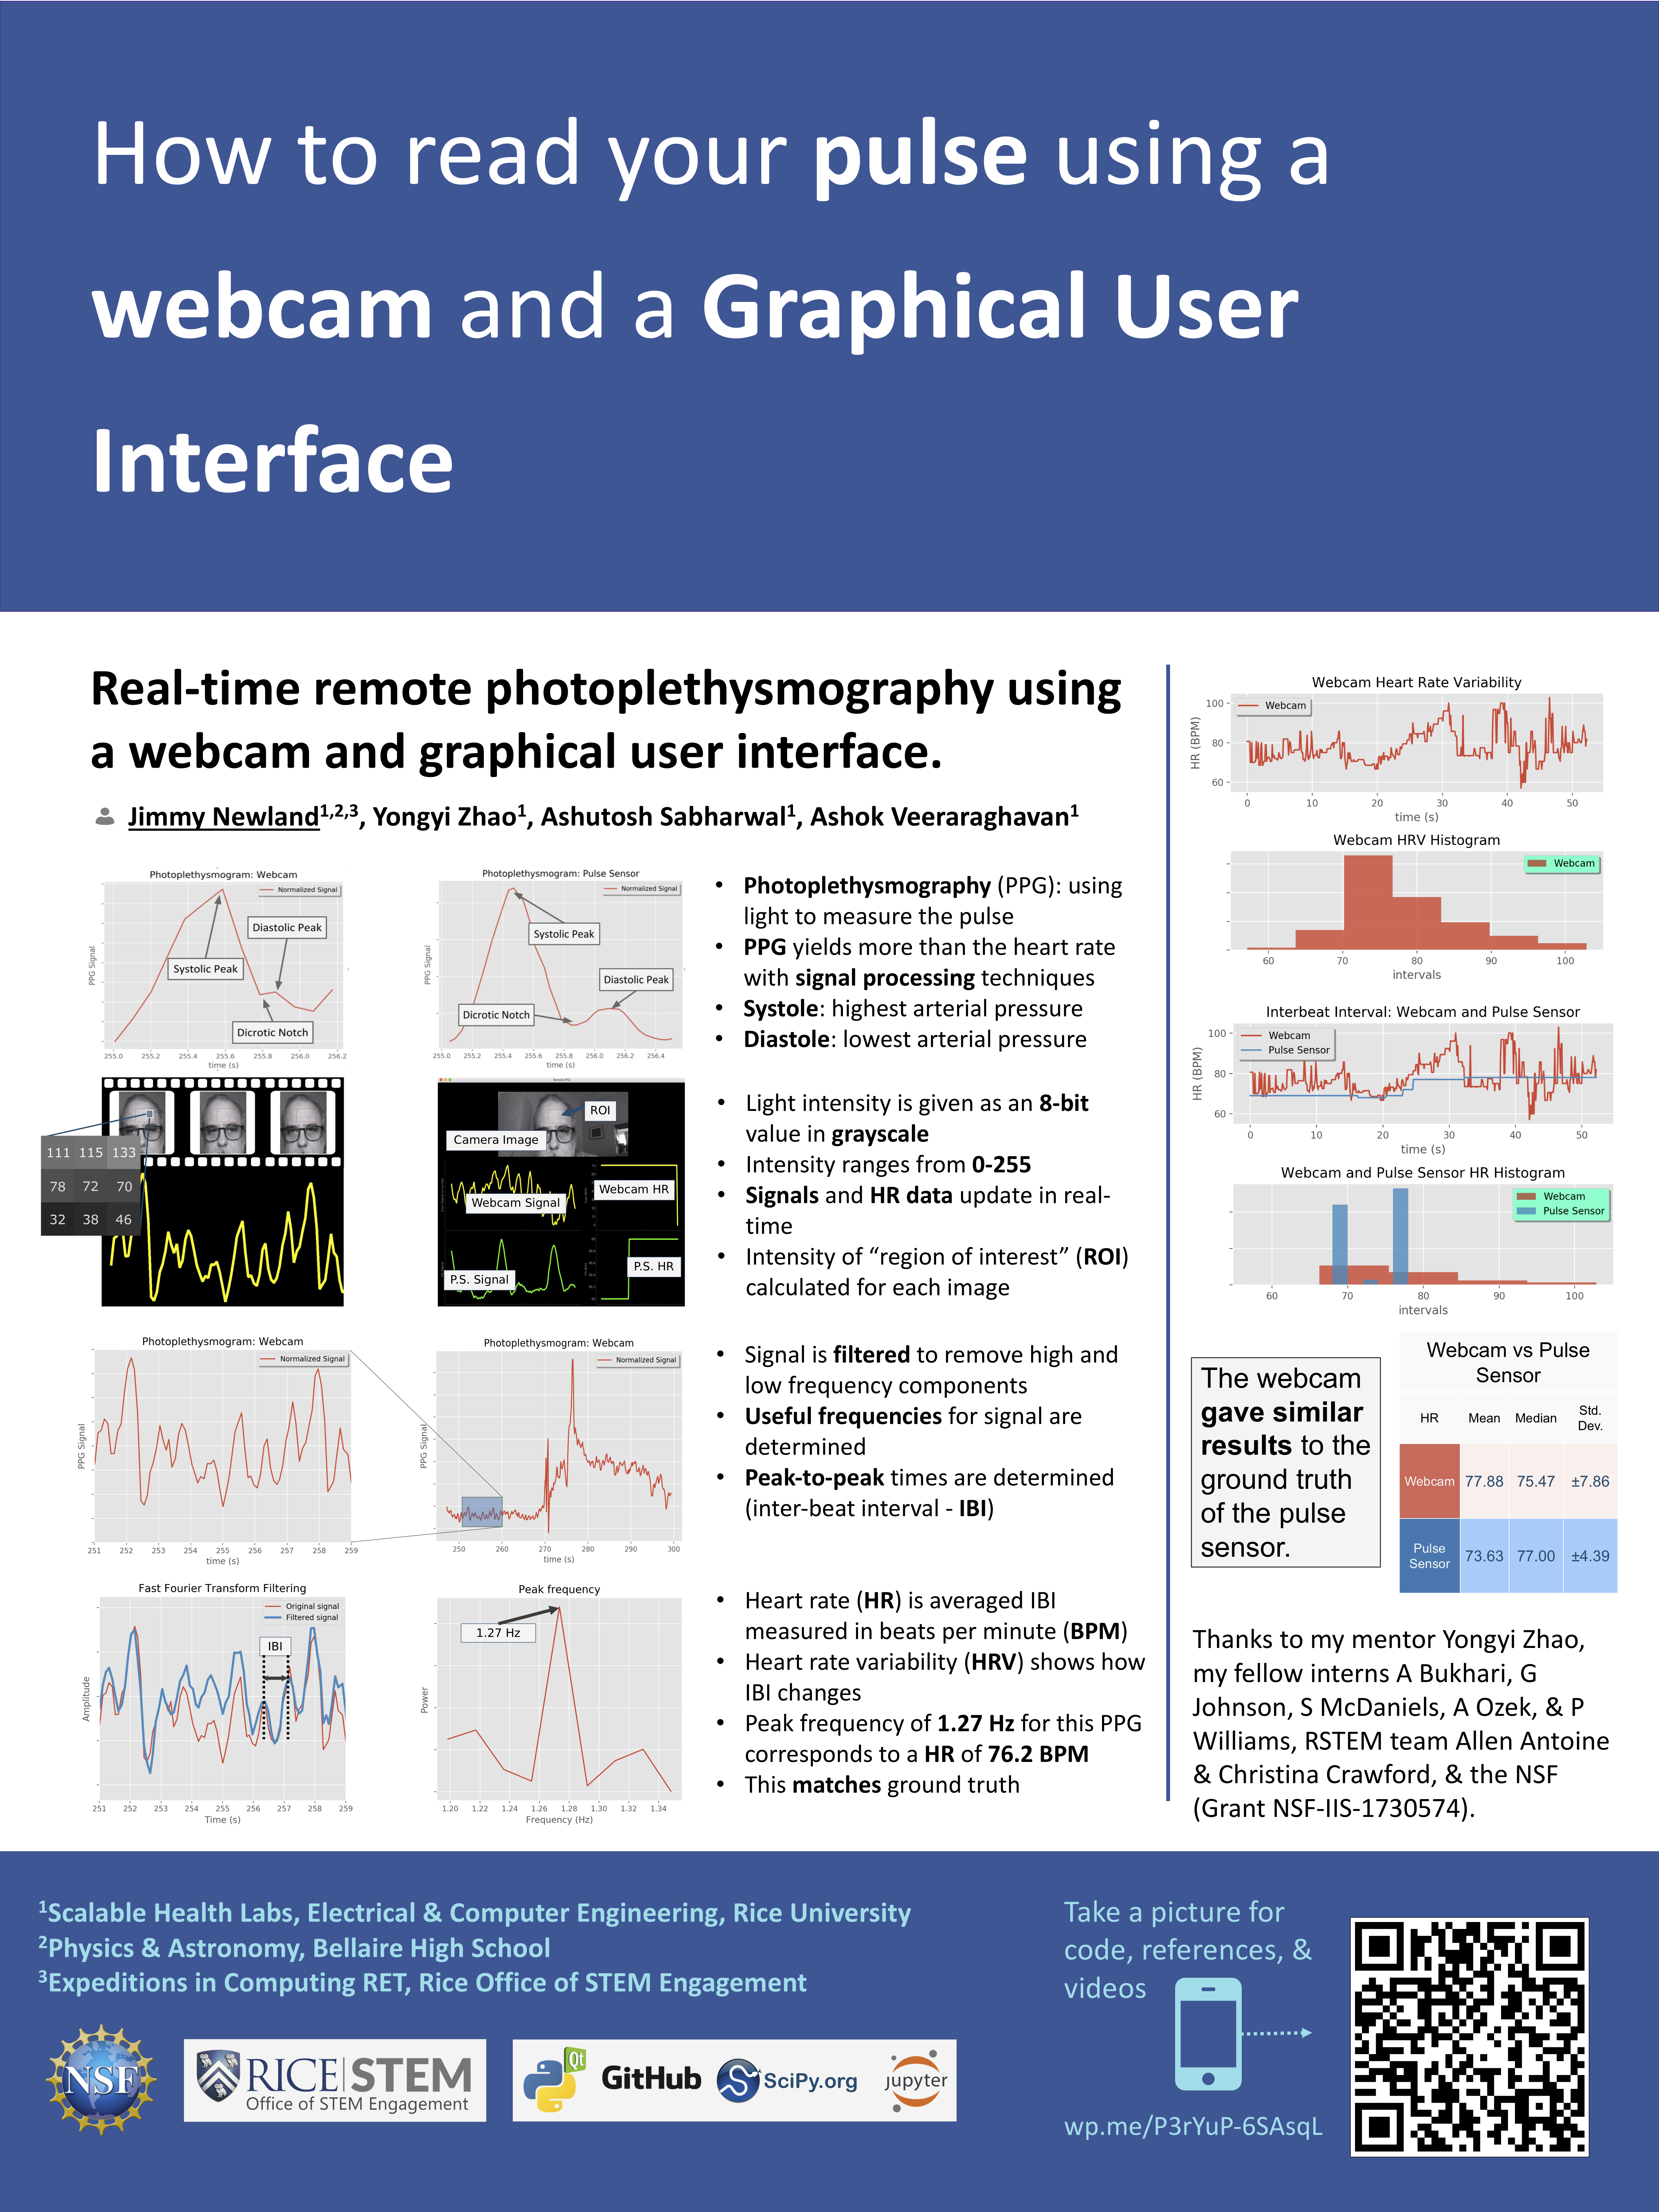
Photoplethysmography (PPG): using light to measure the pulse
PPG yields more than the heart rate with signal processing techniques
Systole: highest arterial pressure
Diastole: lowest arterial pressure
Webcam Pulse Reader- Remote PPG GUI
Remote PPG GUI Operation
Light intensity is given as an 8-bit value in grayscale
Intensity ranges from 0-255
Signals and HR data update in real-time
Intensity of “region of interest” (ROI)calculated for each image
PPG Digital Signal Processing
PPG Signal from Webcam
Signal is filtered to remove high and low frequency components
Useful frequencies for signal are determined
Peak-to-peak times are determined (inter-beat interval – IBI)
Filtering with Fast-Fourier Transform
Filtered signal (left) and Fast-Fourier Transform of PPG (right)
Heart rate (HR) is averaged IBI measured in beats per minute (BPM)
Heart rate variability (HRV) shows how IBI changes
Peak frequency of 1.27 Hz for this PPG corresponds to a HR of 76.2 BPM
This matches ground truth
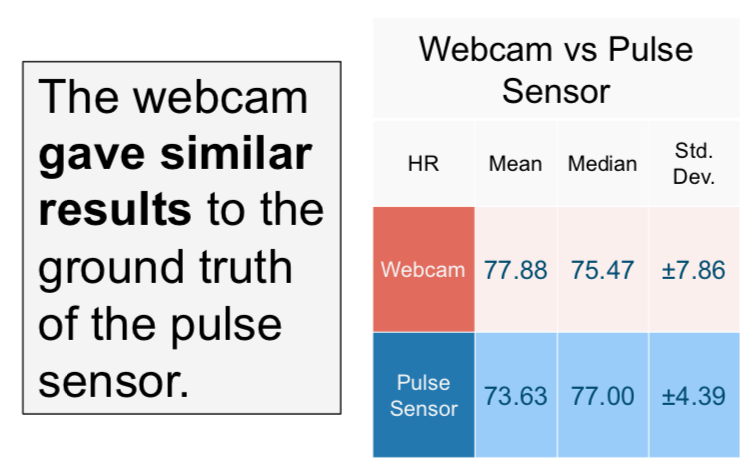
Comparing Webcam and Pulse Sensor PPG
Webcam HRV plot and HistogramComparison of HRV and Histogram between Webcam and Finger Pulse SensorResult: it worked!
Acknowledgements
Thanks to my mentor Yongyi Zhao, my fellow interns Azka Bukhari, Gary Johnson, Shelia McDaniels, Ali Ozek, & Pamela Williams, RSTEM team Allen Antoine & Christina Crawford, & the NSF Expeditions in Computing (Grant NSF-IIS-1730574).
This week the lab has been under maintenance routines. I learned how to transfer the liquid helium from the Dewar to the probe tank of the Magnetic Properties Measurement System.
Also, how to load a resistivity sample puck, Macy explained the maintenance routine for the glove box and how to change a filter.
Glove box
Finally, I witness how to take apart the X-ray diffractometer. Cool eh! I remember taking everything apart when I was a child. Hopefully, I will be able to obtain my data before Monday, since I’m still waiting to analyze a a sample.
This is where the magic happens. The round black disk is my sample.
The main board.
K-12 Educators Disseminating Research from Rice University, Arizona State University, and University of Texas-El Paso


