All posts by Jimmy

Physics and astronomy teacher at Bellaire High School

Real-time remote photoplethysmography using a webcam and graphical user interface

Basic question to be answered

See the poster from 2019 RET Summer Symposium

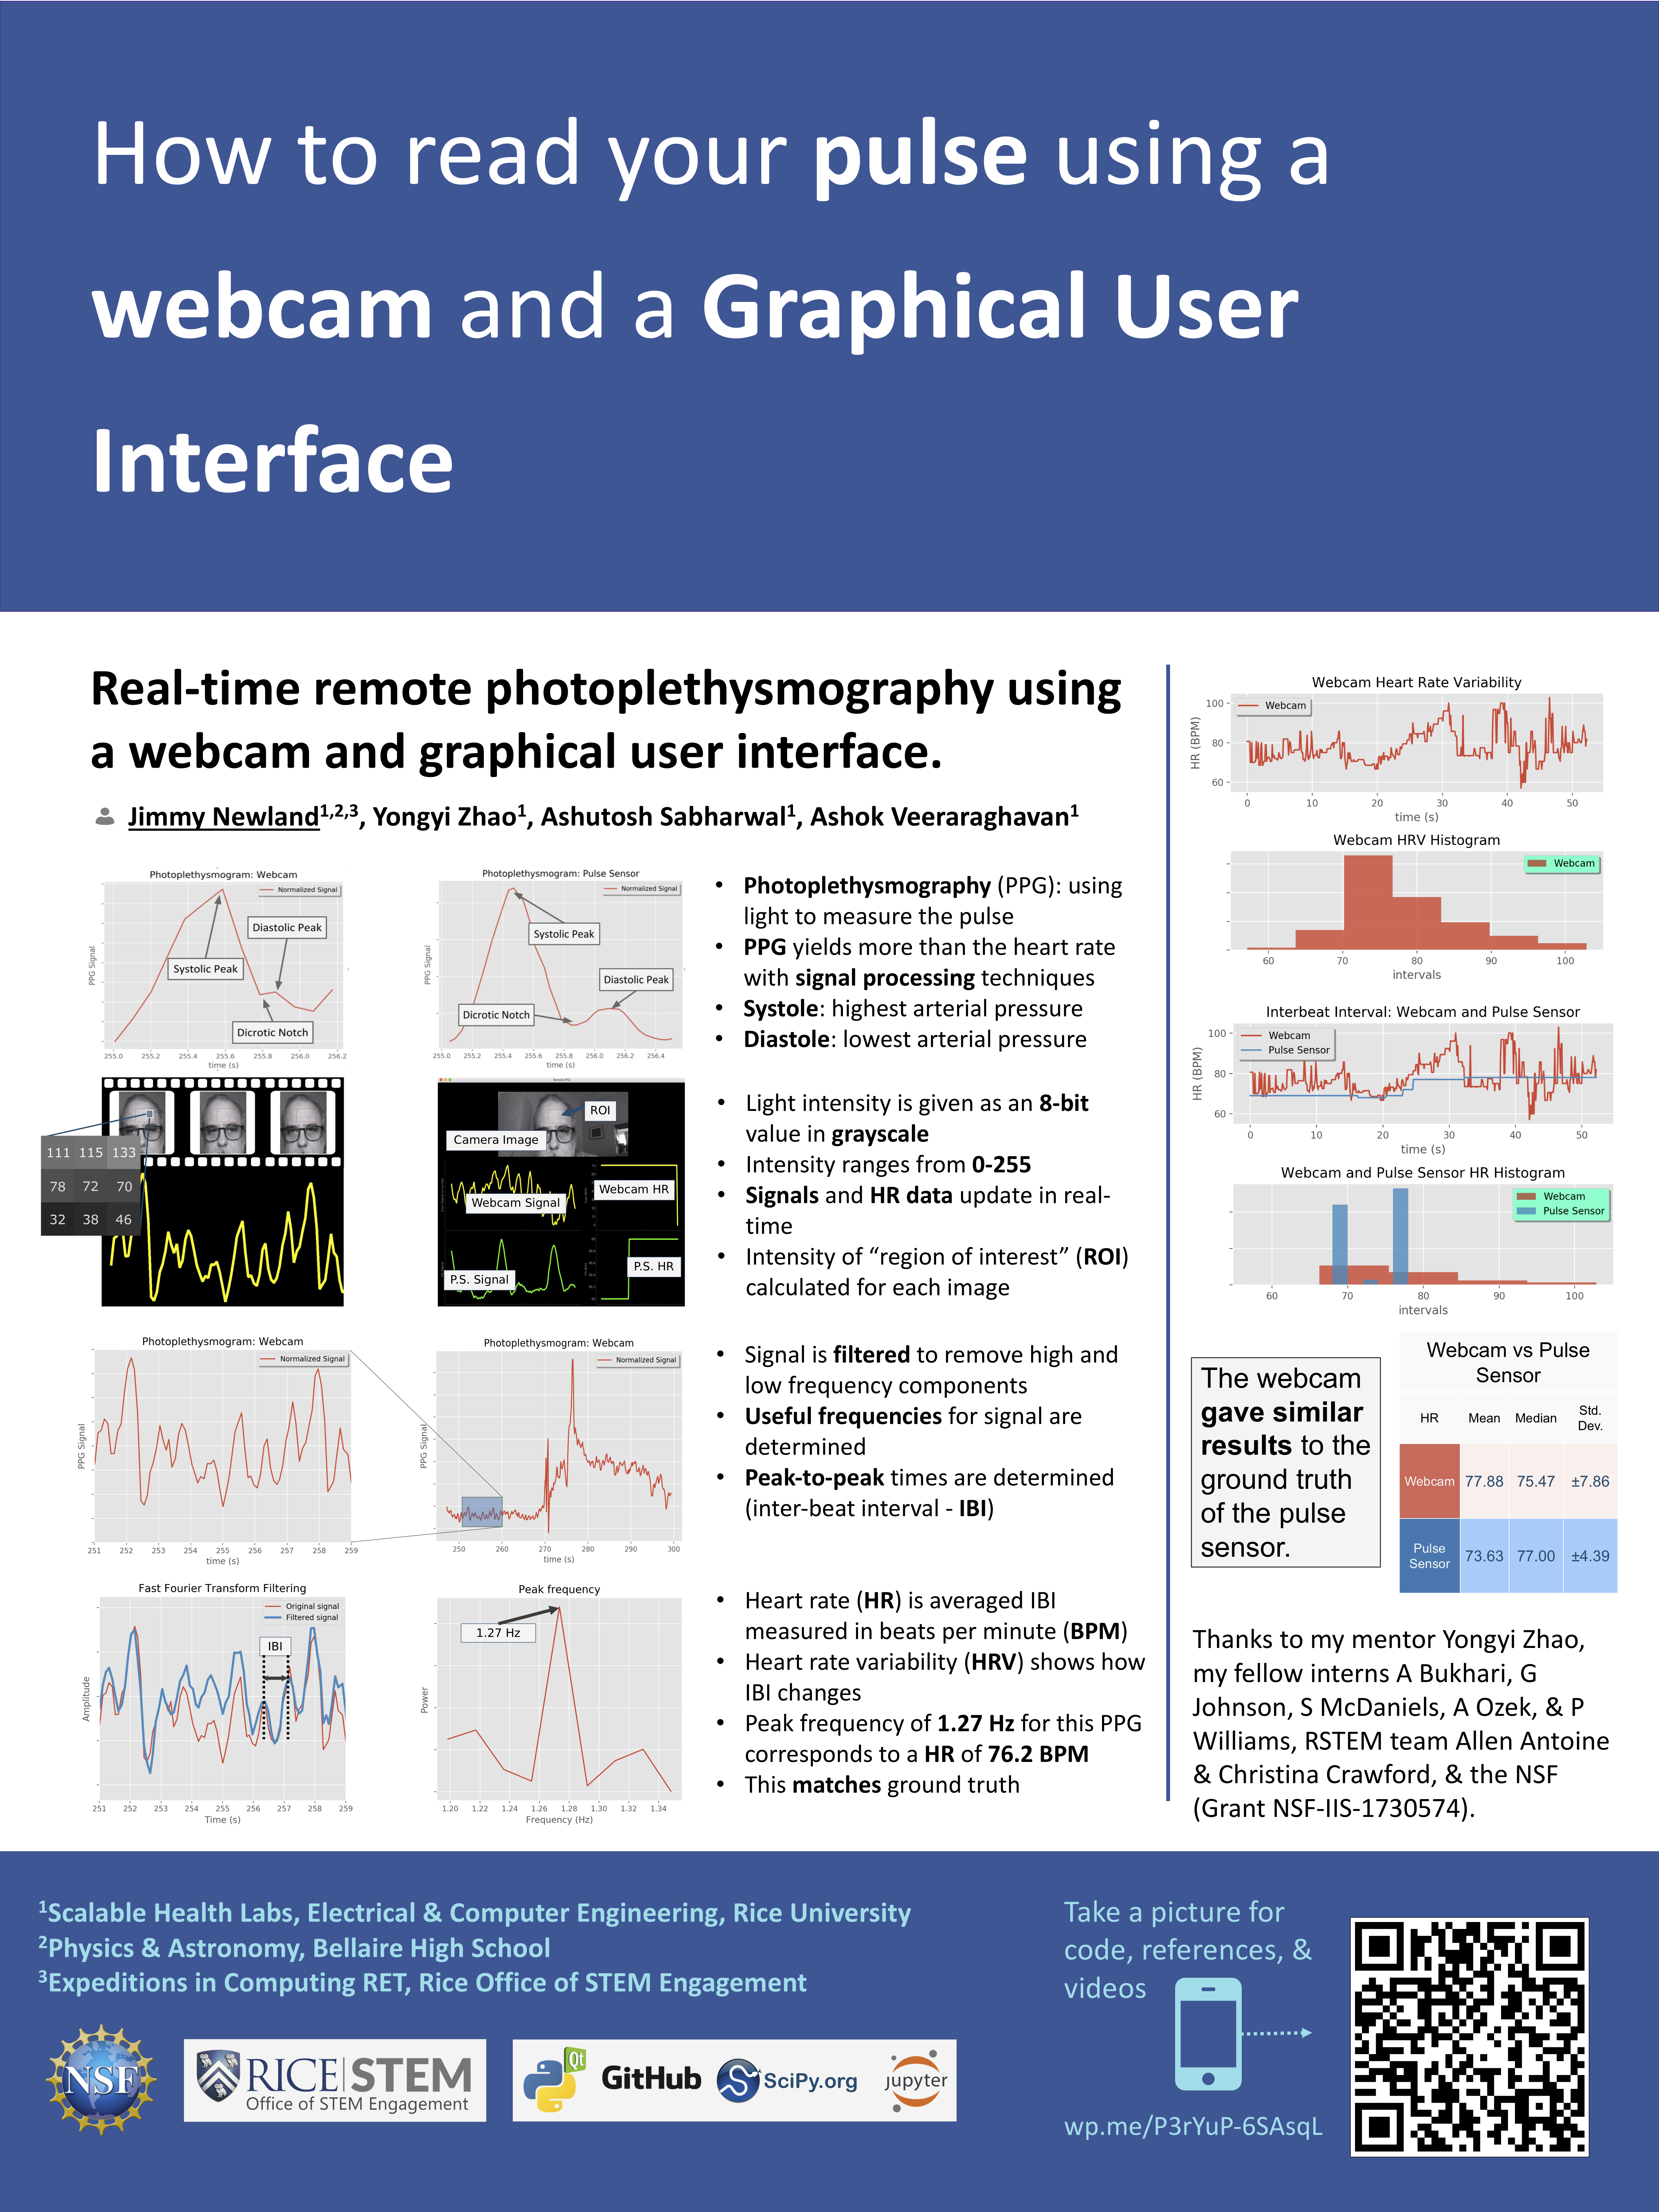
What is photoplethysmography?

Single Pulse read from Webcam and Finger Pulse Senso
  • Photoplethysmography (PPG): using light to measure the pulse
  • PPG yields more than the heart rate with signal processing techniques
  • Systole: highest arterial pressure
  • Diastole: lowest arterial pressure

Webcam Pulse Reader- Remote PPG GUI

Remote PPG GUI Operation
  • Light intensity is given as an 8-bit value in grayscale
  • Intensity ranges from 0-255
  • Signals and HR data update in real-time
  • Intensity of “region of interest” (ROI)calculated for each image

PPG Digital Signal Processing

PPG Signal from Webcam
  • Signal is filtered to remove high and low frequency components
  • Useful frequencies for signal are determined
  • Peak-to-peak times are determined (inter-beat interval – IBI)

Filtering with Fast-Fourier Transform

Filtered signal (left) and Fast-Fourier Transform of PPG (right)
  • Heart rate (HR) is averaged IBI measured in beats per minute (BPM)
  • Heart rate variability (HRV) shows how IBI changes
  • Peak frequency of 1.27 Hz for this PPG corresponds to a HR of 76.2 BPM
  • This matches ground truth

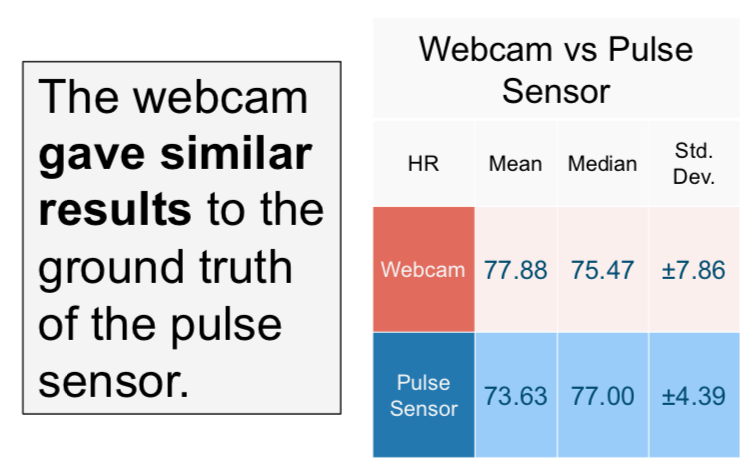
Comparing Webcam and Pulse Sensor PPG

Webcam HRV plot and Histogram
Comparison of HRV and Histogram between Webcam and Finger Pulse Sensor
Result: it worked!

Acknowledgements

Thanks to my mentor Yongyi Zhao, my fellow interns Azka Bukhari, Gary Johnson, Shelia McDaniels, Ali Ozek, & Pamela Williams, RSTEM team Allen Antoine & Christina Crawford, & the NSF Expeditions in Computing (Grant NSF-IIS-1730574).

Poster time!

I think I’m done with my poster for the symposium. Next I need to work on my symposium presentation, but one thing at a time.

This week has been a lot of MatPlotLib, SciPy, and NumPy searches.

Last week, while being off from research, I still worked a lot. I had a breakthrough and was able to glide on in to finishing the actual project so I could start the poster this week. You can see a demo of remote PPG webcam pulse detector below.

Weeks 2 and 3: All GUI’d up

MAKING A GUI IS HARD!

I was away last week but was still working on Python. This week I managed to get a graphical user interface working that showed both the output from the camera as a signal but also from a pulse sensor as well.

Here is my short script to actually measure the frame rate of the webcam. My Macbook Air does 30 fps which is very common.

I spend the majority of the week learning to work with GUI elements in Python. This means windows, buttons, images, and general stuff where a program runs in a window instead of in the terminal. I had to learn how to add plots, and scale, and “listen” for events like a mouse click. In Python this is called signals and having a python program act on a signal is done with a slot. You create a program component (a function) to respond when a signal is given.

Here is an animated GIF showing a comparison of the signals from the camera versus a finger pulse sensor. The top window is the raw camera feed. Note my finger is covering the camera fully here. I have yet to get the peak detection to work very well.

First iteration: got the camera signal and image to display in a GUI.

Second iteration: got the camera signal and the

I also added Butterworth bandpass filtering to the signal which seems to need my signal to noise ratio to improve. And I am using HeartPy to find the peaks in the signal. Both processes worked to some degree but the whole system is so environment dependent that I can’t say it is in beta… more like alpha version. But progress is progress.

I also wrote code to save the streams of data as CSV files which can be processed as a whole after the fact.

I want to add some other stuff to the GUI like buttons to start and stop and the readings from the pulse sensor and the camera. Plus signal analysis using a fast Fourier transform is going to be hard.


Week 1: Back into Python

This week, I had to re-learn some lessons from last summer about working with Python and serial ports and files and libraries and GitHub and… It was a week filled with “getting into the weeds”. I didn’t feel like the biology learning curve was bad at all for me, unlike the other team members. They are learning about the biology of pulses, and Python, and signal analysis all at the same time.

Back row (L to R): Pam, Gary, Ali, Yong (Rice ECE PhD graduate student; PATH-UPS mentor)
Front row (L to R): Me, Jimmy, and Azka

Working in a team and not on my own is fantastic and a lot of fun. I went from the facilitator to intern in just a weekend.

It’s quite an adjustment. But we are all working well together. Spending SO much time together, day after day, can be tough but you learn how to work together very well and how to trust one another as well.

Tuesday:

Wednesday:

Friday: